Candlestick-PatternsUnderstanding Bullish Candlestick Patterns - A Guide to Market Analysis
Learn about bullish candlestick patterns and their role in market analysis. This article explores common patterns and their significance in understanding market behavior.
What is a Bullish Candlestick Pattern?
A bullish candlestick pattern is a graphical representation of price movement in a financial market. It consists of one or more candlesticks that form a specific pattern, indicating a potential upward movement in price.
Common Bullish Candlestick Patterns
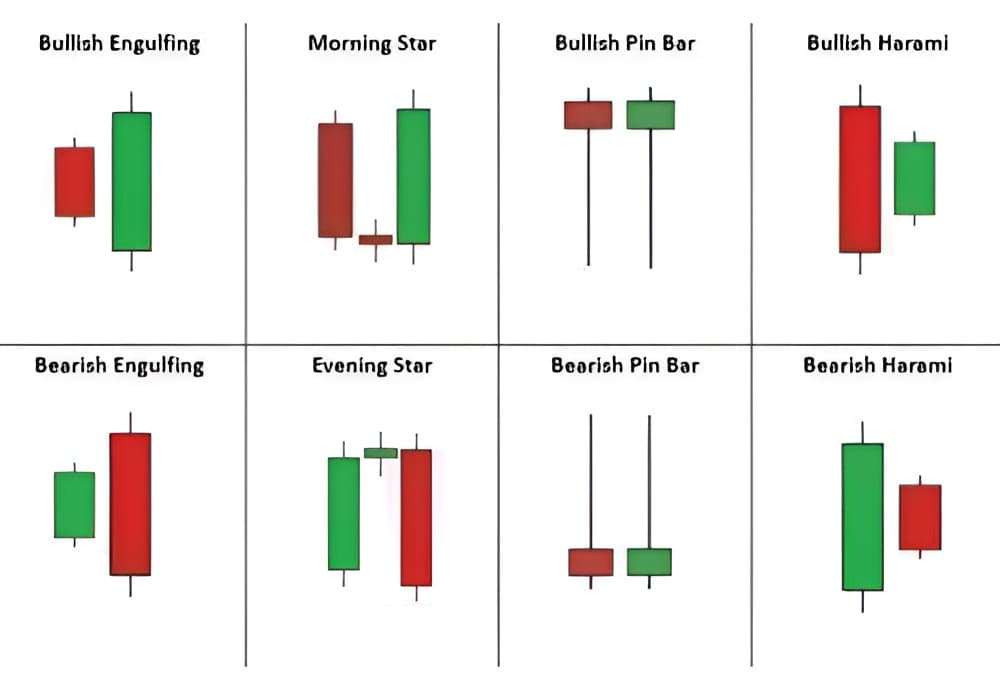
1. Bullish Engulfing Pattern
The Bullish Engulfing Pattern is a pattern that occurs at the end of a downtrend. It consists of two candles:
- A small bearish candle
- A larger bullish candle that completely engulfs the previous candle
Key characteristics of this pattern:
- Support Levels: Price movements often occur at significant support levels
- Volume: Trading volume can indicate market activity
- Price Movement: The pattern shows a shift from downward to upward price movement
- Market Behavior: This pattern reflects changes in market participant behavior
- Technical Analysis: It's one of many tools used in market analysis
This pattern demonstrates significant buying activity overcoming previous selling activity.
2. Hammer Pattern
The Hammer Pattern is characterized by:
- A small body at the top of the candle
- A long lower shadow (at least twice the length of the body)
- Little to no upper shadow
Key characteristics:
- Price Movement: Shows price rejection at lower levels
- Market Activity: Indicates increased buying activity at lower prices
- Pattern Formation: Demonstrates specific market behavior patterns
- Technical Analysis: Used as part of broader market analysis
This pattern shows price rejection at lower levels with increased buying activity.
3. Inverted Hammer
The Inverted Hammer is characterized by:
- A small body at the bottom of the candle
- A long upper shadow (at least twice the length of the body)
- Little to no lower shadow
Key characteristics:
- Price Movement: Shows price rejection at higher levels
- Market Activity: Indicates increased selling activity at higher prices
- Pattern Formation: Demonstrates specific market behavior patterns
- Technical Analysis: Used as part of broader market analysis
This pattern shows price rejection at higher levels with increased selling activity.
4. Piercing Line Pattern
The Piercing Line Pattern is a two-candle pattern:
- A long bearish candle
- A bullish candle that opens below the previous close but closes above the midpoint of the bearish candle
Key characteristics:
- Price Movement: Shows a shift from downward to upward price movement
- Market Activity: Indicates increased buying activity
- Pattern Formation: Demonstrates specific market behavior patterns
- Technical Analysis: Used as part of broader market analysis
This pattern indicates increased buying activity overcoming previous selling activity.
5. Morning Star
The Morning Star is a three-candle pattern:
- A large bearish candle
- A small-bodied candle (either bullish or bearish) that gaps down
- A large bullish candle that closes above the midpoint of the first candle
Key characteristics:
- Price Movement: Shows a gradual shift in price direction
- Market Activity: Indicates changing market participant behavior
- Pattern Formation: Demonstrates specific market behavior patterns
- Technical Analysis: Used as part of broader market analysis
This pattern shows a gradual shift in price movement over three periods.
6. Three White Soldiers
The Three White Soldiers pattern consists of three consecutive long-bodied bullish candles, each opening within the previous candle's body and closing near its high. This pattern shows consistent upward price movement.
Key characteristics:
- Price Movement: Shows consistent upward price movement
- Market Activity: Indicates sustained buying activity
- Pattern Formation: Demonstrates specific market behavior patterns
- Technical Analysis: Used as part of broader market analysis
This pattern shows consistent upward price movement over three periods.
7. Doji (Dragonfly Doji)
The Dragonfly Doji is characterized by:
- A T-shaped candle with a long lower shadow
- Little to no body and upper shadow
Key characteristics:
- Price Movement: Shows price rejection at lower levels
- Market Activity: Indicates balanced buying and selling activity
- Pattern Formation: Demonstrates specific market behavior patterns
- Technical Analysis: Used as part of broader market analysis
This pattern shows price rejection at lower levels with balanced market activity.
Important Considerations
When analyzing candlestick patterns, consider these points:
- Market Context: Consider the overall market environment and price levels
- Volume Analysis: Volume can provide additional context to price movements
- Multiple Indicators: Use various market analysis tools for comprehensive understanding
- Pattern Recognition: Patterns are part of broader market analysis
Conclusion
Candlestick patterns are valuable tools for market analysis, but they're most effective when used as part of a comprehensive market research approach. Modern market analysis platforms offer solutions to streamline your research process.
Diplyzer, a market analysis platform, provides tools that help you:
- Identify candlestick patterns across multiple assets
- Analyze market sentiment and market participant behavior
- Track price movements and market activity And more...
The platform covers various markets including:
- Stocks (S&P 500, Nasdaq 100, and Dow Jones)
- Forex markets (over 89 currency pairs)
- Cryptocurrencies (more than 450 digital assets)
- Commodities
By leveraging Diplyzer's technology for pattern recognition and data analysis, you can focus on understanding market behavior and conducting thorough market research.
Disclaimer: This article is for informational and research purposes only. We do not provide investment advice, trading recommendations, or financial advice. Trading in financial instruments involves substantial risk of loss and is not suitable for all investors.